Using Reinforcement Learning to Evaluate Navigability of Masterplan

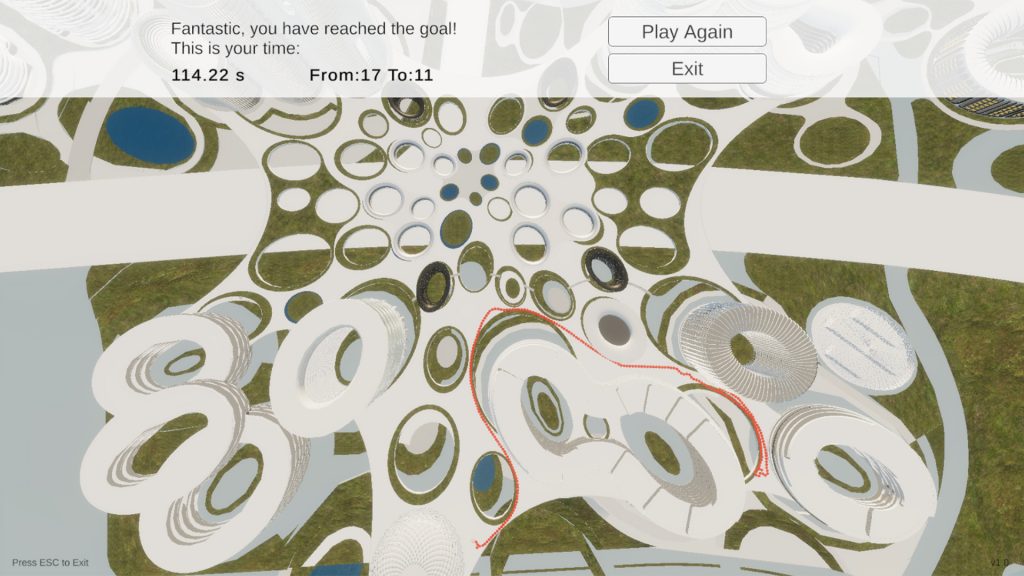
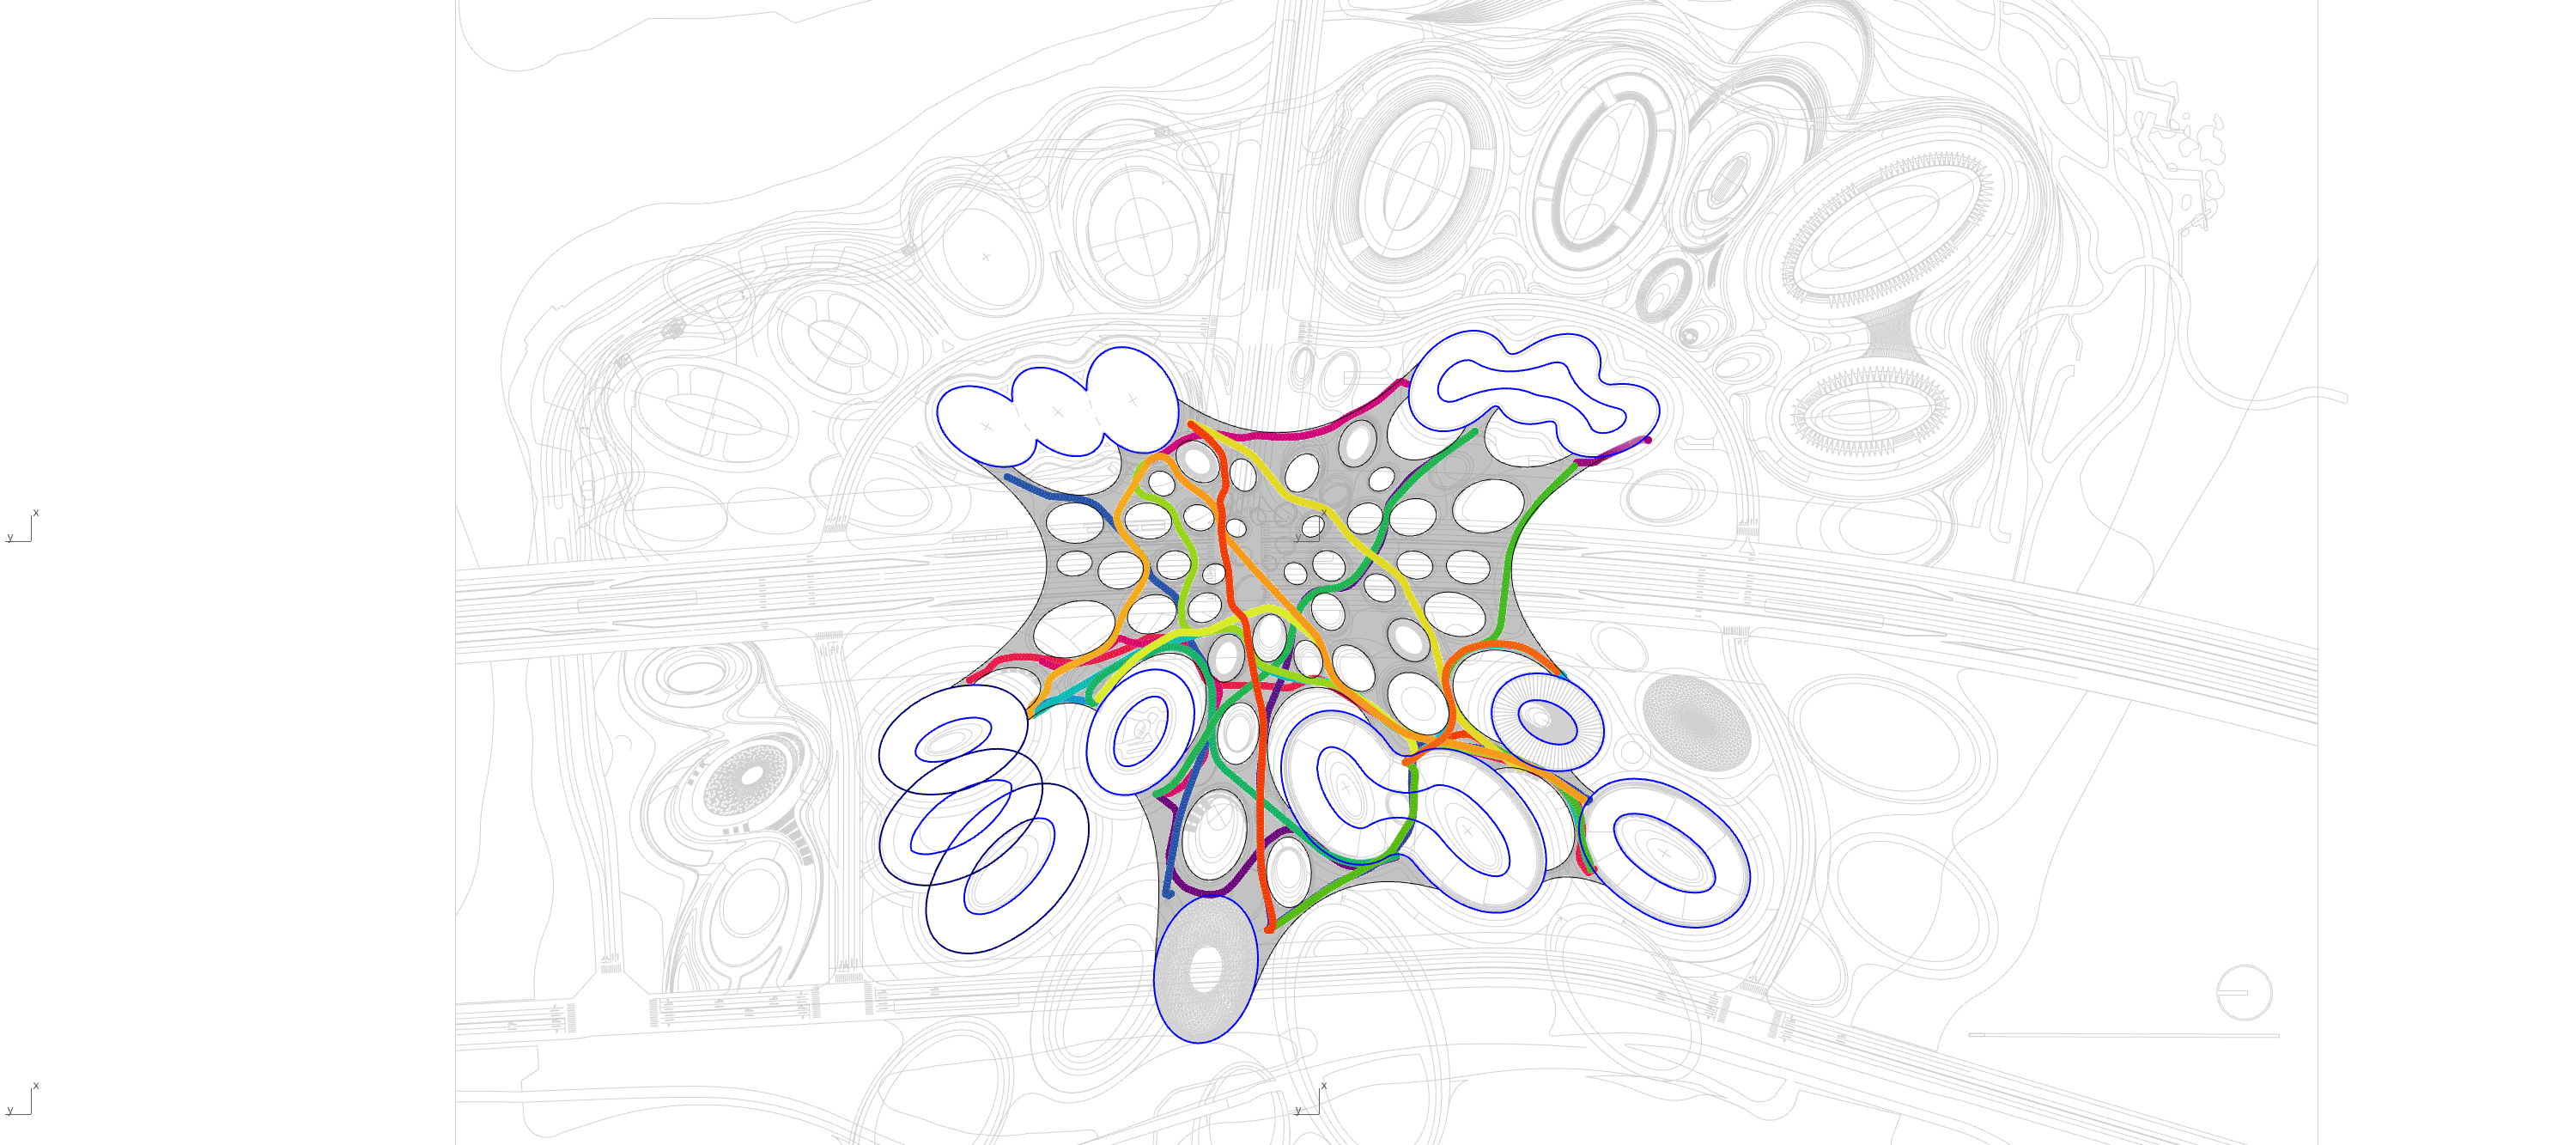
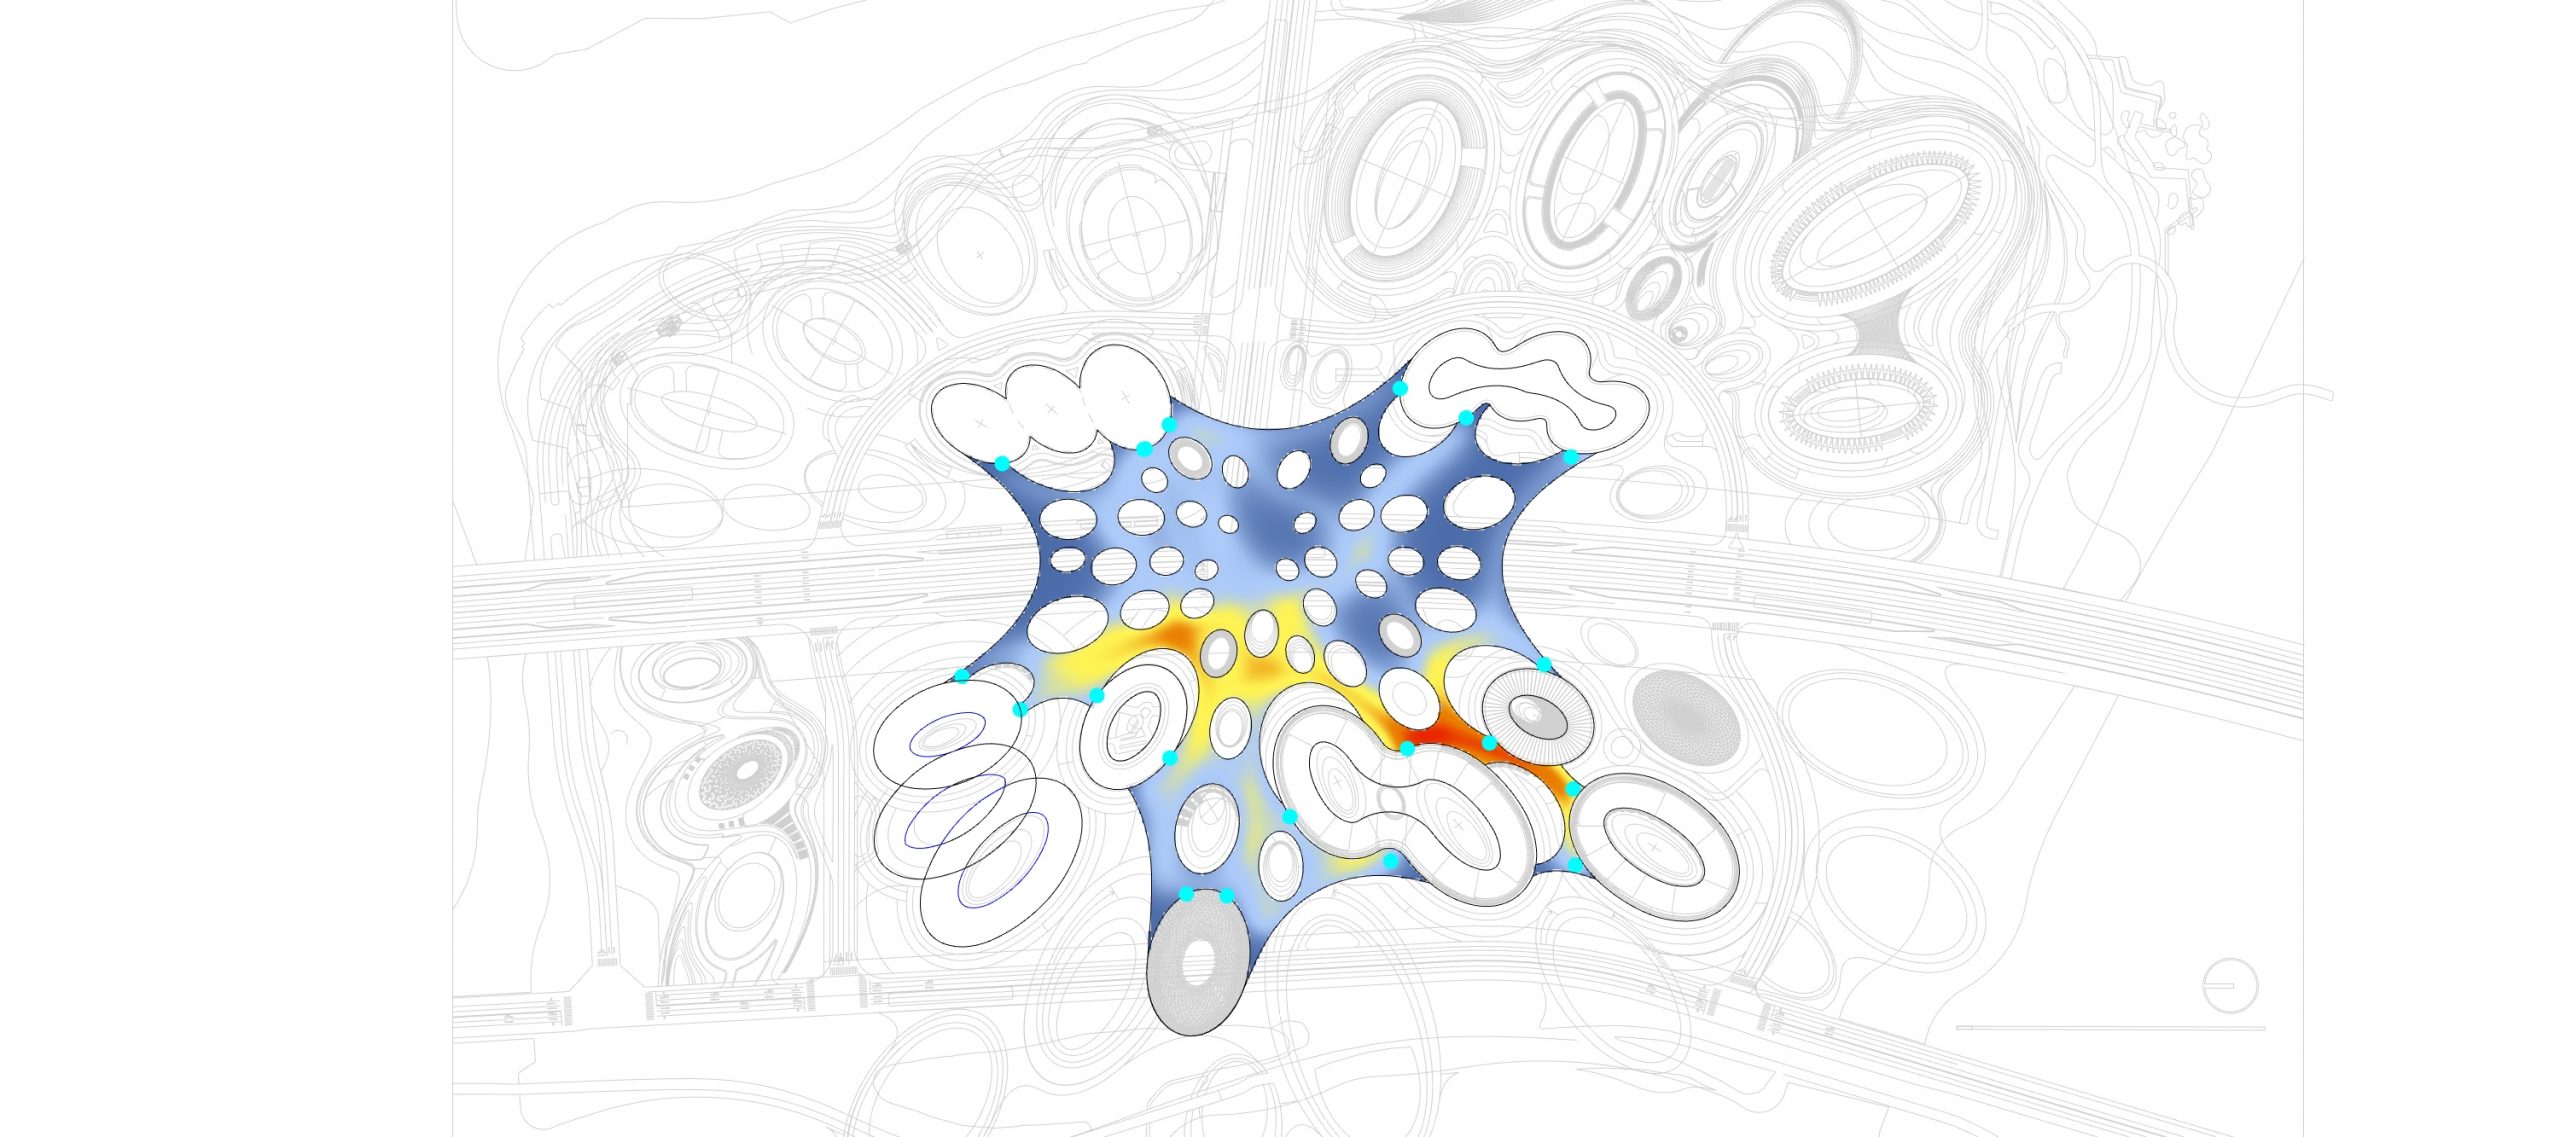
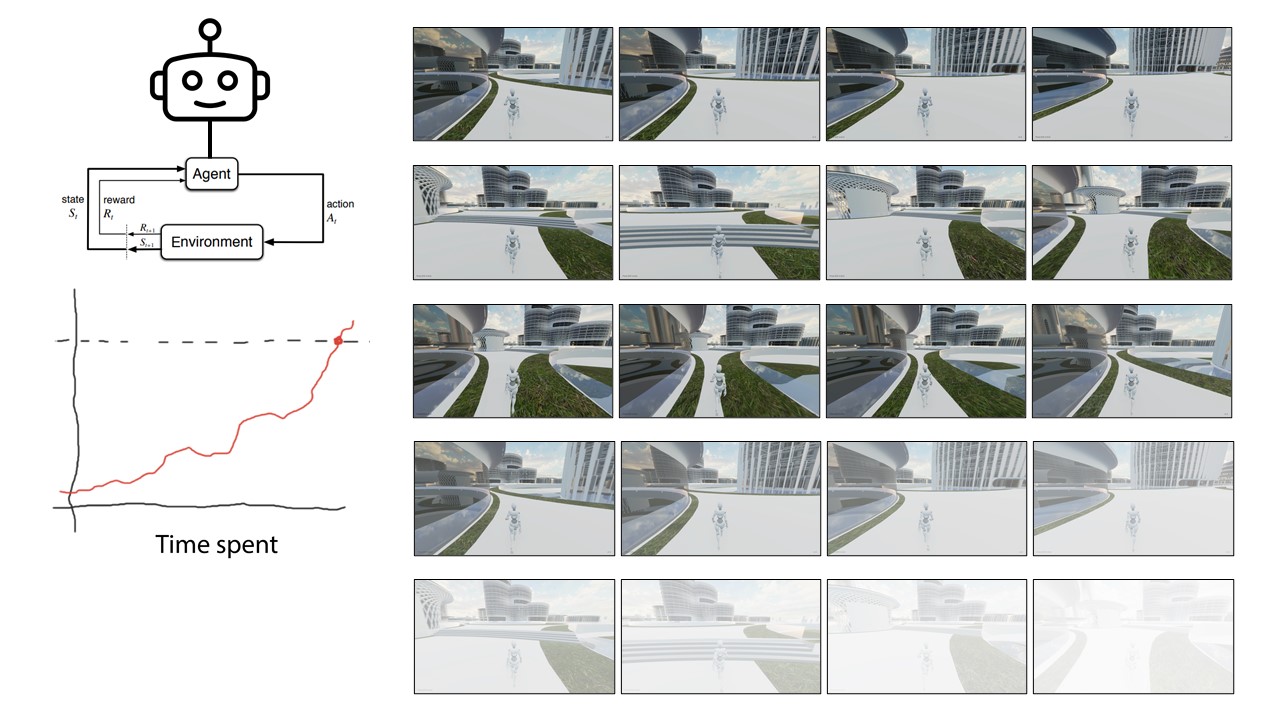
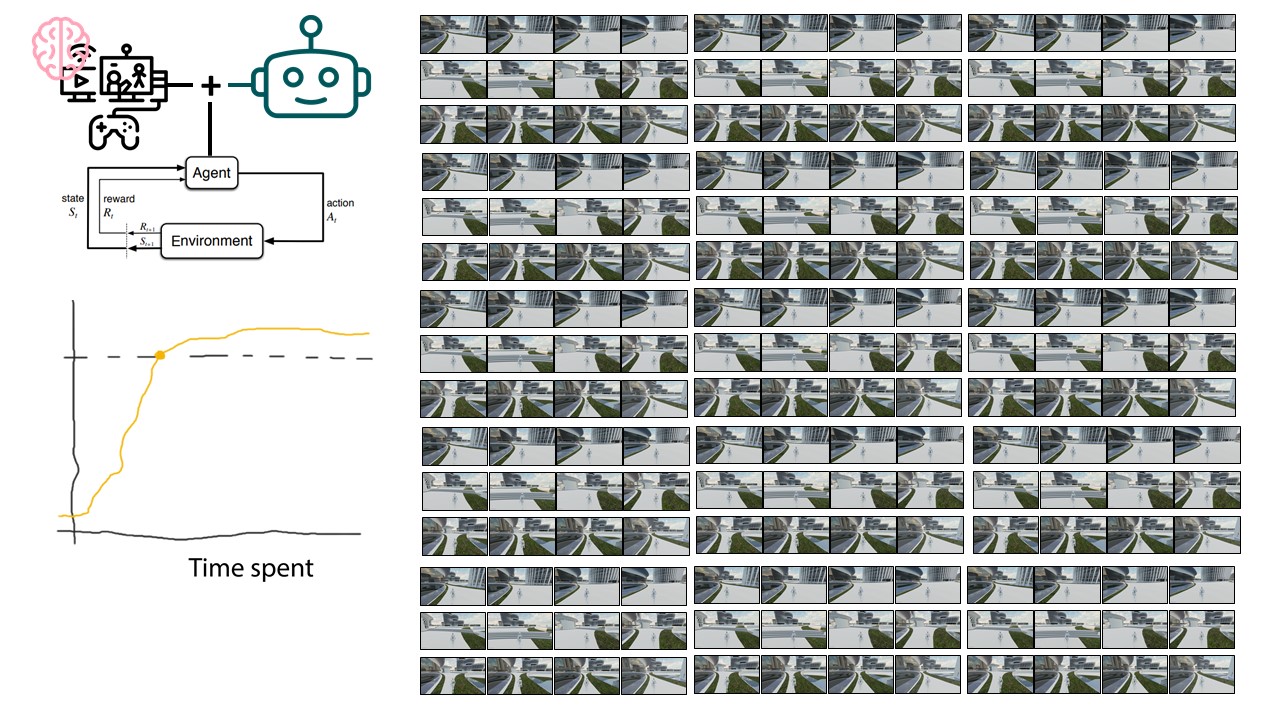
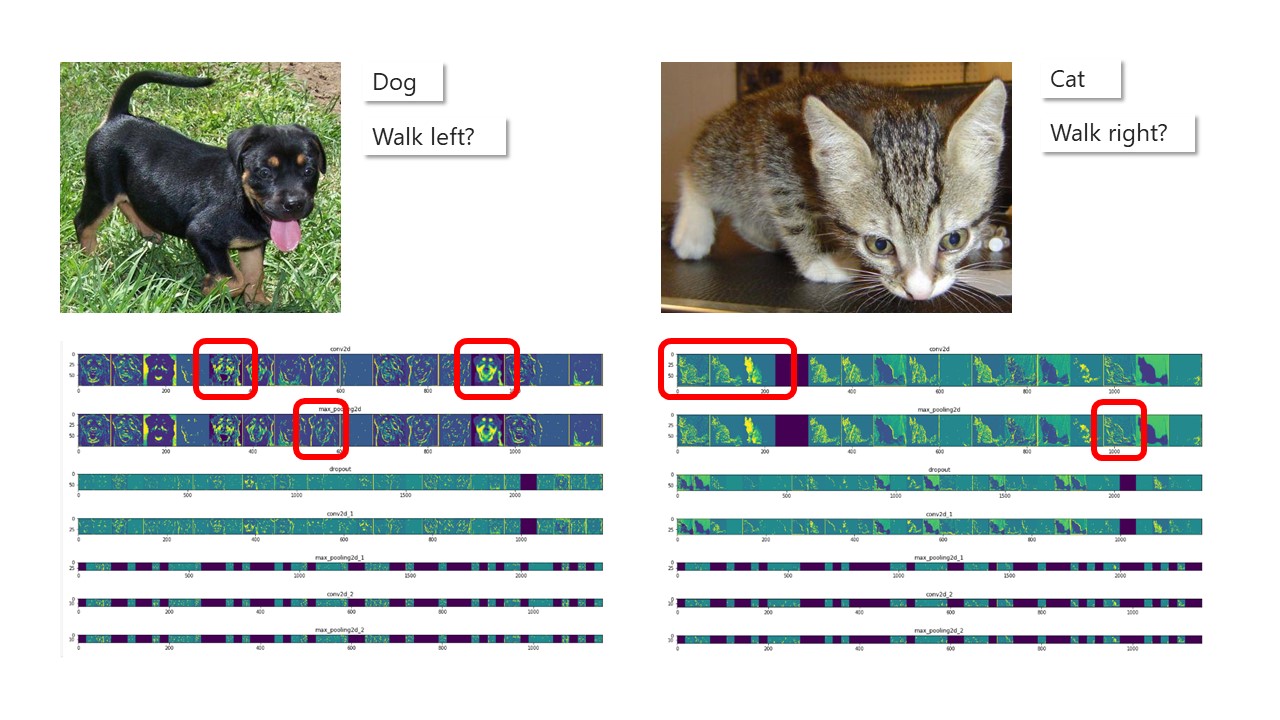
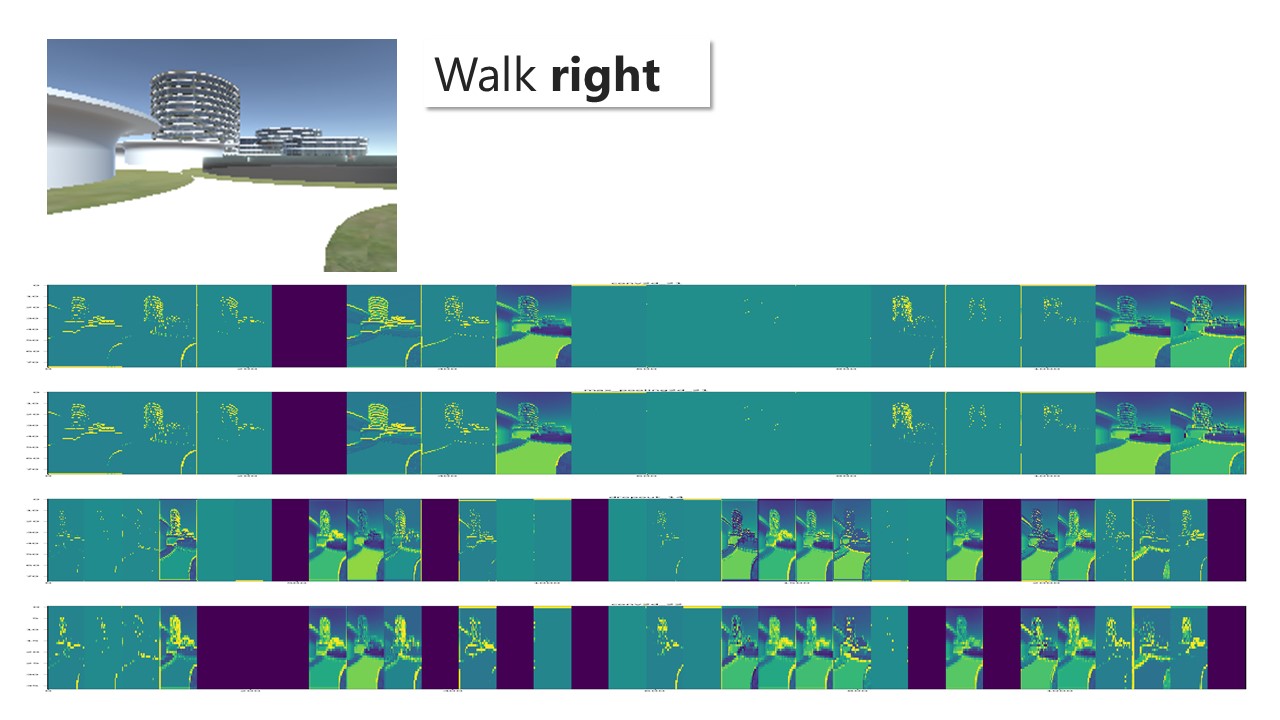
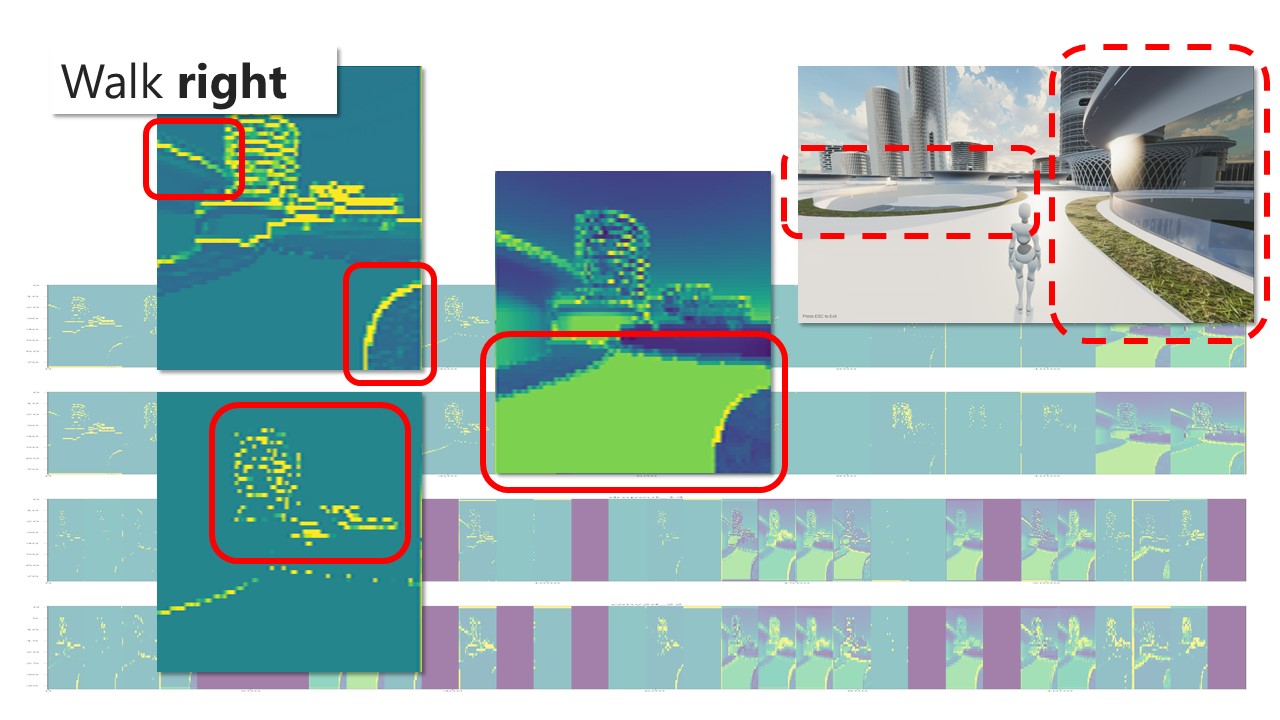
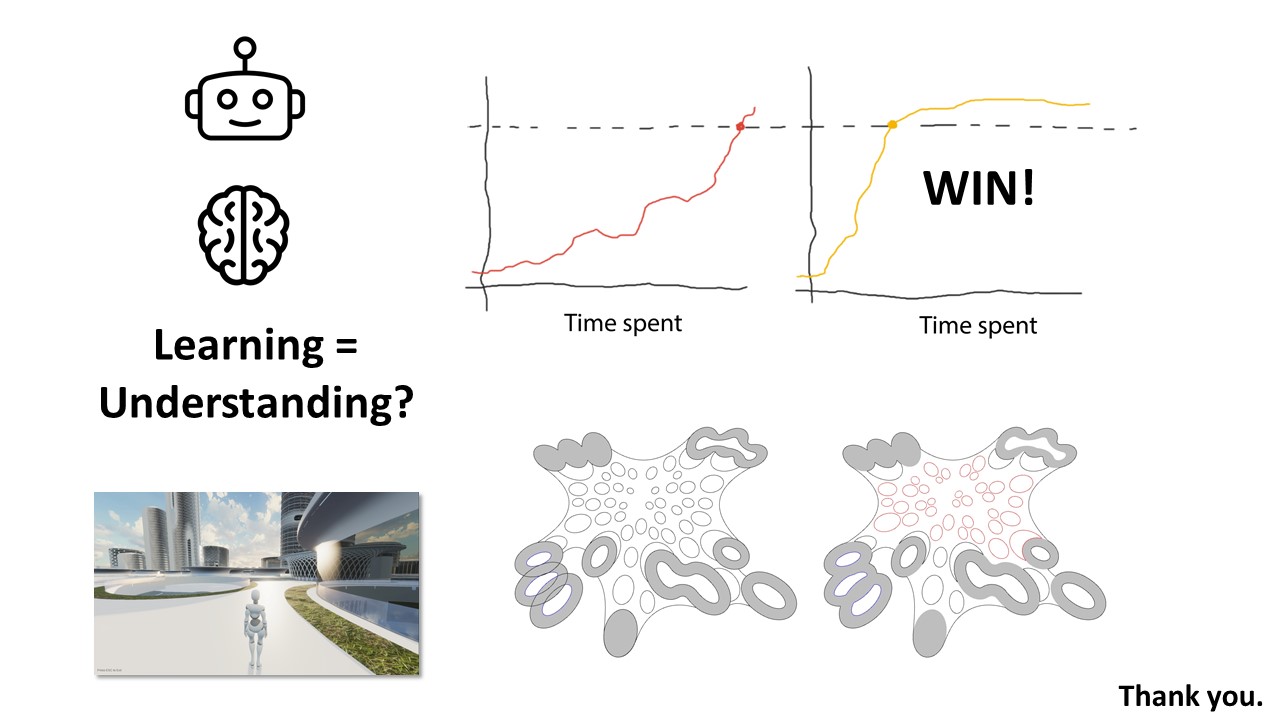
Path finding, footfall analysis and natural path analysis have been important analysis methods for urban designers. Navigability, visual connection between high-frequency pedestrian paths and points of interests, such as shops, amusement, restaurants, but also open plazas and enclosed alleys are important factors for a working urban fabric. Simulating pedestrians has been utilised, especially in the field of civil engineering, egress strategies in stadiums but also path analysis on airports to identify potential dangerous bottlenecks. The SpaceSyntax group at the UCL has provided Architects with their agent simulation tool called DepthmapX. The agents in DepthmapX cast rays in a bespoke field of view and navigate towards the longest ray, which seems quite far from how a human being would navigate space. This project looks into collecting human navigation data through a first-person game and maps the movement taken at each frame. This allows identifying image patterns, such as edges, texture, colour etc., that trigger specific actions of the player in the game to finish a bespoke navigation task. Furthermore, the data can be used as a baseline for a reinforcement learning agent. The trained agent can be used to evaluate the navigability of architectural schemes. The speed at which the agent is learning can be used as a proxy for navigability and therefore feedback to the designer. Good visual cues help the agent and human to navigate space better.

Unicorn Island Masterplan, Zaha Hadid Architects

The Game

Controls:
In the Game you can use the A,W,S,D keys to navigate. W and S keys to walk forward or backward. A and D keys or your mouse will let you turn left or right.
Enter Nickname and Play:
You can enter a Nickname, otherwise your name will be randomly chosen "Anonymous1234". Press the "Play" button to start the game or exit to close the application. (Note: At any time you can press the "ESC" key to close the application)
The Task:
In the next screen you will see the description of a randomly assigned task.
Your goal:
Your goal is to try to memorise what you see on the screen and try to navigate through the Unicorn Island Masterplan to reach the red sphere at the "Target" location, also indicated with the red pointer. The blue pointer with the text "Your Position" is the location where you will be spawned once you start the game.
Finish:
Once you finished the game, you will see a red path, to see how you navigated through the Unicorn Island Masterplan, as well as required time and for reference the indexes of your spawn location as well as the goal location. (In the example below spawn location at index with the index 17, goal location with the index 11)
Help:
HELP! In case you get stuck, or just cannot find the goal, press the "ESC" key to either play again or give up and exit the application.

Data

Data Collection
What data is collected and what is it used for? There are two types of data collected, Path Data as well as Demonstration Data. The Path Data is a collection of data points as well as general game-play data. The Demonstration Data is a set of neural network weights, which are using the pixel values of the screen as well as the key press data while playing.
1. Path Data
Once you have played the game, there will be a folder in the extracted game folder called Deomstrations (File location: ../Unicorn_Island_Walking_Analysis_Data/Demonstrations/). This is where your data is being stored for you to look at. Go ahead and open the text file ending in .._path_data.txt. (Example file name: 2021-04-18 02-42-30_Anonymous2880_path_data.txt) In the file you will see your nickname, the indexes of the target as well as the goal, if the goal has been reached and the time needed, this is followed by point locations of your steps. Anonymous2880 11,10 goal reached time:20.14834 (-123.9, 10.0, 523.3) (-125.6, 10.0, 522.2) (-127.5, 10.0, 521.7) (-129.5, 10.0, 521.2) (-131.5, 10.0, 521.0) ...
Data Use:
The data can then be used back in Rhino+Grasshopper to show similar results as this one:
In the grand scheme, of course it would be fantastic to actually overlap the data collected from the people at ZHA who played the game to show a heatmap of how people actually moved through the space as a proxy.
2. Demonstration Data
In the same folder as the Path Data called Deomstrations (File location: ../Unicorn_Island_Walking_Analysis_Data/Demonstrations/), there will be a set of files ending with .demo. (Example file name: MyDemo.demo). The file is only readable with a specific reader. The data stored are arrays of pixel values of every frame of the game (i.e. [0, 2, 3, 1, 3, 4, 2, ..., n]), in relation with the actions you have taken in the game (i.e. [W, A, S, W, W, D, ..., n]). This input can now be used for a so called Imitation Learning. This demonstration data is used to train a Reinforcement Learning agent, to navigate the Unicorn Island Masterplan on it's own. So why is the data you have produced so crucial? The visual cues you as players/humans are using to navigate the space are very valuable, and it is very hard to tell the Reinforcement Learning agent what those cues are exactly. Even for us it is very hard to determine. Could those cues be edges, directionality or color and texture?
In essence:
The data you have produced will give insight on what patterns of the image are triggering you to take a specific action. So whats next? The data you have produced will now be a baseline for the Reinforcement Learning agent, instead of starting/learning from scratch, the agent now knows patterns to look out for - Thank you! And what is this good for?
Quick story: Imagine, you have two toddlers, both of them still need to learn how to walk. One of the toddler is training in the living room, with a wooden floor, the other one in the bedroom with carpet. The two training curves could look something like this:
Let's bring this back to architecture. Imagine we have two different schemes for the Unicorn Island Masterplan. We want to know, how well each scheme can be navigated, because we don't want people to get lost, rather find their way as quickly as possible, in ideal cases without google-maps on their phone. We can use the Reinforcement Learning agent with your human pattern recognition and decision making baseline and see on what scheme the agent is learning quicker to navigate. The scheme which is helping the agent to learn quicker, is the one better navigable. The two schemes below have two different design strategies, one with a more field like distribution, the other clusters of 3. On which scheme will the agent learn to navigate quicker? Can this proxy be used as a decision making tool - a navigation tool built with human data?
Initial Results
Paths of all participants so far:
Heat-map of all paths:
Synthetic Data Creation using Reinforcement Learning
The very valuable data produced by human players is basically decision making data. At each frame you automatically decided to turn left, right or go straight depending on the visual observation.

Let me introduce Reinforcement Learning to you. This is an AI paradigm, which in a nutshell does not need data to learn, but learns by trial and error. But there is a way to super-power reinforcement learning by infusing it with human based real data, which is called imitation learning. On the top you can see a RL agent after the same amount of training without your data, on the bottom the super-infused agent. This helps me to produce a huge amount of synthetic data, powered by human behaviour over night. Now instead of just about 200.000 frames and according decisions, I am basically able to produce endless amounts of data.

Reinforcement Learning Agent
Reinforcement Learning Agent + Human Demonstrations
Synthetic Data: Behaviour Data Analysis
With the big amount of data I can utilize more straight forward Machine Learning algorithms, for example a Convolutional Neural Network, to really drill down and attempt to find out what visual patterns trigger specific actions.

Others use this to distinguish between dogs and cats. And it’s quite interesting, how specific facial features but also the outline and silhouette really matter.
I love animals, but I really want to find out what are architectural patterns that people see and act on. This is an initial feature map of patterns you have been deciding on whether to go left, right or straight:
Lets look at some of this patterns a bit closer. So it seems that the edge of the funnel, as well as materiality change on the ground, but also land-mark buildings in the background really drive decision making. This can help me as a designer to understand what architectural features might help to navigate potentially more fluid shapes and spaces as intuitively as possible:
Outlook:
After I have a human-trained RL agent, I can also of course with the same baseline of knowledge evaluate spaces with the objective to optimize navigatability. How quick can my agent learn to navigate a specific space and can learning be equalized or set in relation with understanding? For now I will leave that to you...